Home Battery Cost 2026: The Installed Price, Line by Line

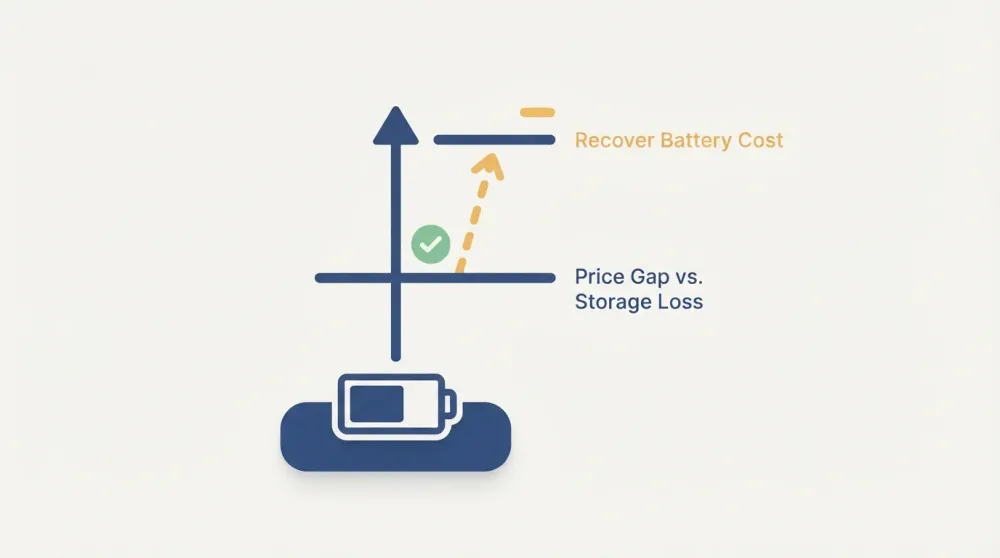
Time of use battery savings come from one move: charging a home battery when electricity is cheap and running the house from it when electricity is expensive. The battery pays for itself only if two hurdles are cleared. The gap between peak and off-peak prices has to beat the energy the battery loses in storage, and what is left has to recover the battery's own cost for every kWh it delivers over its life. In the worked example below, built from one real utility tariff, a grid-charged battery clears the first hurdle easily and, even on generous assumptions, recovers only about a quarter of its price in 15 years.
This page is about the purchase decision: whether the arithmetic works on a given rate. It does not cover how to schedule appliances around a rate. It covers the United States only. Rate designs are set utility by utility, approved by state regulators, and they change, so the tariff used here is one example, not yours. Confirm your own current rates with your utility before acting on any figure below, and read nothing here as a promise of savings.
On a time-of-use rate, the utility charges different prices for the same kilowatt-hour depending on when you use it. A battery changes when you buy, not how much you use: it fills during cheap hours and supplies the house during expensive ones. The value of each kWh it shifts is the peak price you avoid, minus what it cost to put that kWh into the battery, including the part that is lost along the way.
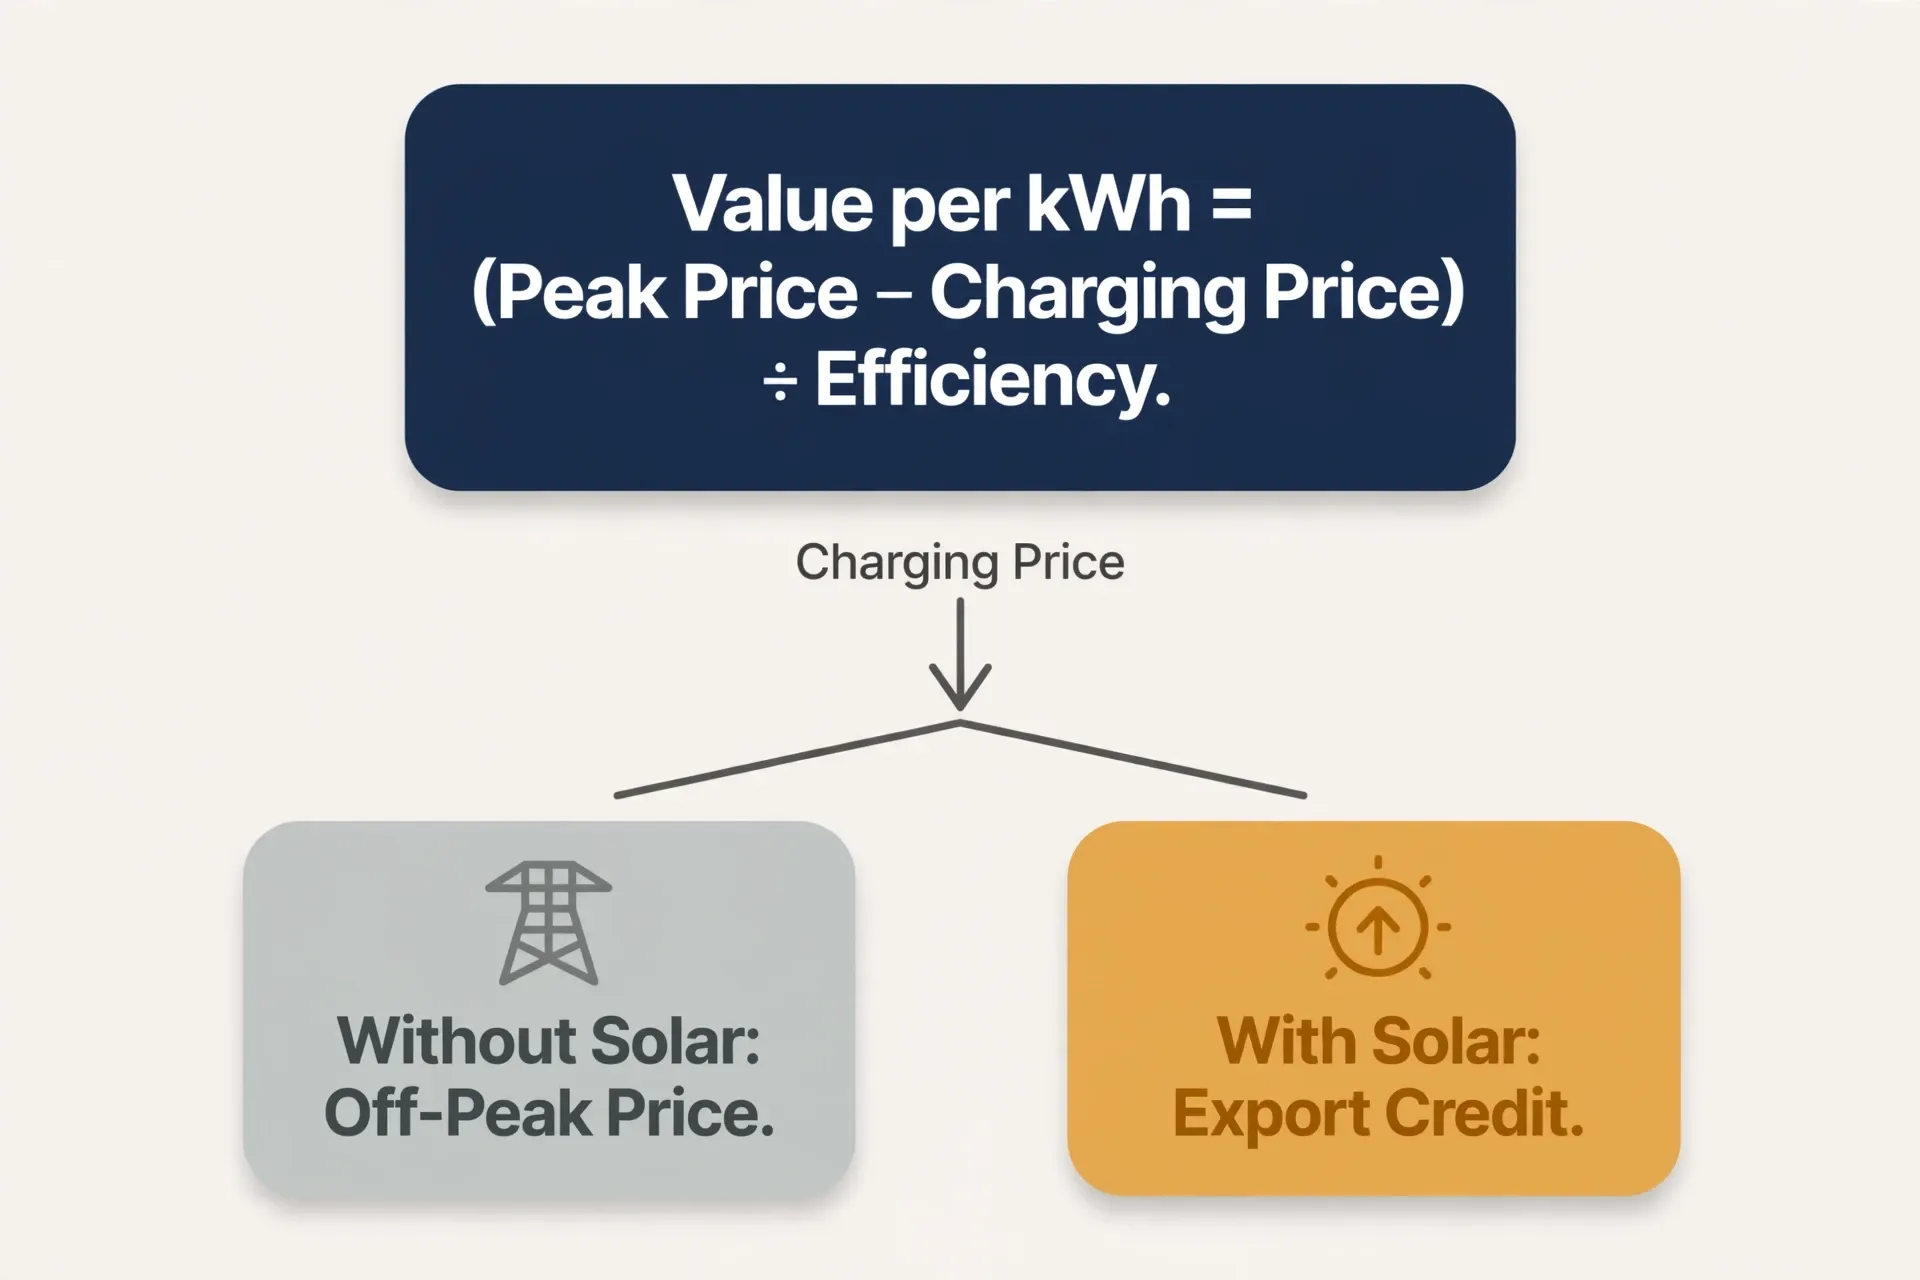
Written as a line, value per kWh shifted equals the peak price minus the charging price divided by the battery's round-trip efficiency. Everything else on this page is that line with real numbers in it.
There are two versions of the charging price. Without solar, it is your off-peak grid price. With solar, it is whatever the utility would have credited you for exporting that same solar energy instead of storing it. The two cases behave very differently, so they are worked separately below.
A battery never returns everything that goes into it. The Annual Technology Baseline published by the National Laboratory of the Rockies, read September 24, 2026, uses 85 percent as a representative round-trip efficiency for residential battery storage. For every 10 kWh bought to charge the battery, about 8.5 kWh comes back out.
That sets a floor. A grid-charged cycle saves nothing unless the peak price is higher than the off-peak price divided by 0.85, which works out to about 18 percent higher. On any rate where the peak price sits less than about 18 percent above the off-peak price, every grid-charged cycle loses money before the battery's purchase price is even counted.
The second hurdle is the one the savings examples that rank for this subject tend to leave out. A battery is bought once and then delivers a limited amount of energy over its life, so part of its purchase price rides on every kWh it ever supplies.
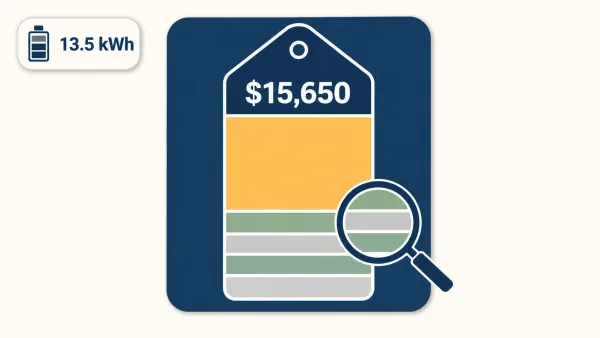
EnergySage's marketplace data for the first half of 2026, read September 24, 2026, puts a typical installation at about $15,650 for 13.5 kWh, before incentives. The same Annual Technology Baseline models residential batteries at about one cycle per day over a 15-year lifetime. Take both at face value and the battery delivers at most about 73,900 kWh (13.5 kWh a day for 5,475 days), which spreads its price at roughly 21 cents per kWh delivered.
Those assumptions are generous. They ignore financing costs, assume a full cycle every single day, and assume the battery lasts the full modeled life. Fewer cycles push the cost per kWh up, not down. Your own figure depends on your installed price, your usable capacity, and any cycle or throughput limit written into your warranty.
Georgia Power's Nights & Weekends rate plan (read September 24, 2026) has a wide gap between its peak and off-peak prices, which makes it a useful test case. Its on-peak price is $0.303 per kWh, charged June through September, Monday to Friday, 2 to 7 p.m. Every other hour, including all weekends, July 4 and Labor Day, is off-peak at $0.078 per kWh. The plan requires a 12-month commitment, and Georgia Power notes the prices do not include fuel costs or additional taxes and fees.
This is an illustration with stated assumptions, not a forecast. It assumes a 13.5 kWh battery charged entirely off-peak and a household that uses the full battery between 2 and 7 p.m. on every peak day.
| Step | Figure | Source or arithmetic |
|---|---|---|
| On-peak price | $0.303 per kWh | Georgia Power |
| Off-peak price | $0.078 per kWh | Georgia Power |
| Cost of 1 kWh delivered from off-peak charging | about $0.092 | $0.078 divided by 0.85 |
| Value of each kWh shifted | about $0.211 | $0.303 minus $0.092 |
| Peak weekdays in 2026 | 87 | June to September weekdays, less Labor Day |
| Energy shifted per peak day | 13.5 kWh at most | Assumes a full battery used in the peak window |
| Ceiling on yearly value | about $248 | 87 days times 13.5 kWh times $0.211 |
| Ceiling over 15 years | about $3,720 | Same ceiling every year, no rate changes |
| Battery price | about $15,650 | EnergySage, first half of 2026 |
The gap clears hurdle one easily: about 21 cents of value on every kWh shifted. The trouble is how rarely that gap exists. It applies on about 87 days a year, and on the other 278 every hour carries the same off-peak price, so there is nothing to shift. Even on the days that count, a household that uses less than a full battery between 2 and 7 p.m. shifts less than the table assumes.
Now set the two hurdles side by side. About 21 cents of value per kWh on a peak day is almost exactly the battery's own cost per kWh at one full cycle every day for 15 years. To break even on the purchase price, a rate would need a gap that wide on nearly every day of the year, not 87 of them, and that is before financing, fuel charges and taxes. On this tariff, grid-charged arbitrage alone covers about a quarter of the battery's price over its modeled life.
Many home batteries are sold alongside solar, and there the energy going into the battery is solar that could otherwise have been exported. The comparison is no longer off-peak price against peak price. It is the export credit against the peak price.
That is why export-rate design matters so much. The California Public Utilities Commission's net energy metering and net billing page (read September 24, 2026) explains that under net energy metering, exports earn bill credits "at the retail rates." Under the Net Billing Tariff, which new solar customers of PG&E, SCE and SDG&E have taken since April 15, 2023, exports are credited "at a rate reflecting the value of this generation to the grid," and that value "is usually lower than the retail rate." Net billing customers are also required to take a specific time-of-use rate with lower off-peak and higher on-peak prices. The CPUC reports that nearly 70 percent of net billing customers had paired batteries with their solar by the end of 2024.
Because the export credit is usually lower than the retail rate, the gap a battery captures by storing solar for the evening is usually wider than the gap it could capture charging from the grid. Where exports are credited at the full retail price of the hour, a battery captures only the difference between midday and evening prices. NEM 3.0 in California explained covers what exports pay there in detail, and net metering by state shows how to tell which kind of export rate your own state uses.
Every figure in the worked example has an equivalent on your own bill and contract. These five decide whether time-of-use savings can repay a battery in your house:
The payback arithmetic is the same honest-inputs method used for panels in calculating your solar payback period: your own numbers, not a national average.
Most of the pages that rank for this subject are published by companies that sell batteries or solar, and the savings examples on them tend to show the price gap and stop there. A figure that leaves out the storage loss and the battery's own cost per kWh is not wrong arithmetic. It is the first half of the arithmetic, and the half that sells the battery.
Two more costs rarely make the slide. If the warranty caps total throughput, a battery cycled every day for savings reaches that cap sooner than one held in reserve. And energy discharged at 6 p.m. to save money is not available for an outage at 7 p.m., so a battery bought for both jobs does each one less completely than the brochure suggests.
It cannot tell you your savings. The worked example uses one tariff in one state, and your utility's prices, windows and export credits will differ. It counts only the time-of-use value, not backup during outages or payments from grid programs, which can add to a battery's value on their own terms. And rates change after you buy. Treat the method as the useful part, run it on your own tariff, and confirm the current rate with your utility before signing anything.
It can shift purchases from expensive hours to cheap ones, but it only saves money if the peak price beats the off-peak price by more than the battery loses in storage. Whether those savings repay the battery depends on how wide the gap is, how many days it applies, and the battery's own cost per kWh delivered.
At the 85 percent round-trip efficiency the Annual Technology Baseline uses, the peak price must be about 18 percent above the off-peak price before a grid-charged cycle saves anything. Repaying the battery takes far more: in the worked example, a gap worth about 21 cents per kWh would have to apply on nearly every day of the year just to break even.
Most published examples multiply the price gap by the energy shifted and stop. They usually leave out the energy lost in storage, the battery's own cost per kWh over its life, and the days when no peak price applies at all.
Yes. With solar, the battery stores energy that could have been exported, so the comparison is the export credit against the peak price. Where export credits sit below retail, as the CPUC describes under California's Net Billing Tariff, the gap a battery captures is usually wider than grid charging allows.
It can, but only with the energy left in it when the outage starts. A battery drained every evening for savings may be partly empty when the grid goes down, so ask how much charge it will hold in reserve for outages.
One email a week with new guides, tips, and solar news. Zero fluff, no sales pitch.